
Hope all is well today ladies and gentleman,
TDT checking in today to get my first week of 2026 projection out to the free world.
If you didn’t get to watch that on YouTube here it is below. This video was suppose to be posted on the Blog yesterday but life as usual tends to get in the way sometimes….
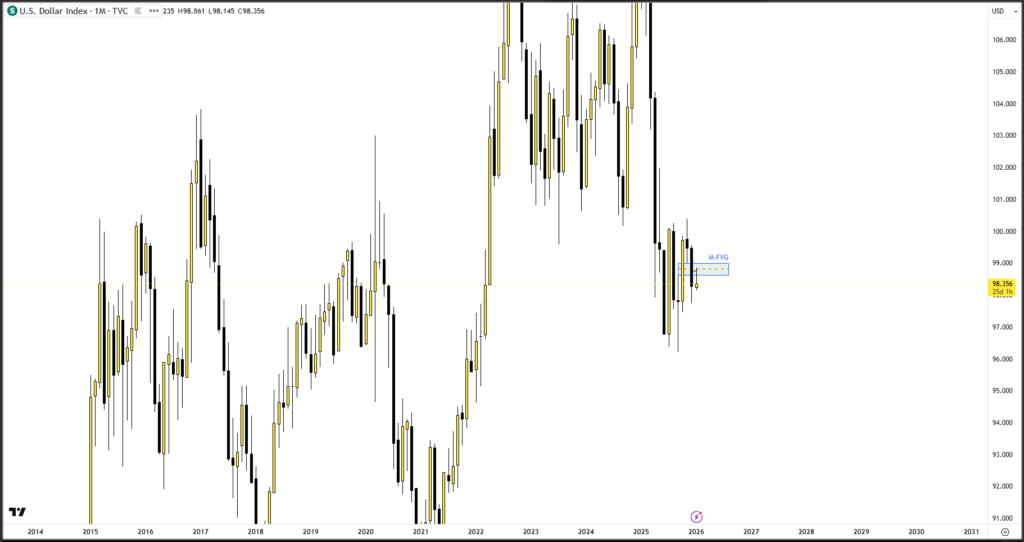
Today in DXY we see that price did enter that Monthly we spoke about in the video above. Price then rejected away from the C.E. of that Monthly FVG
US Dollar Monthly Chart
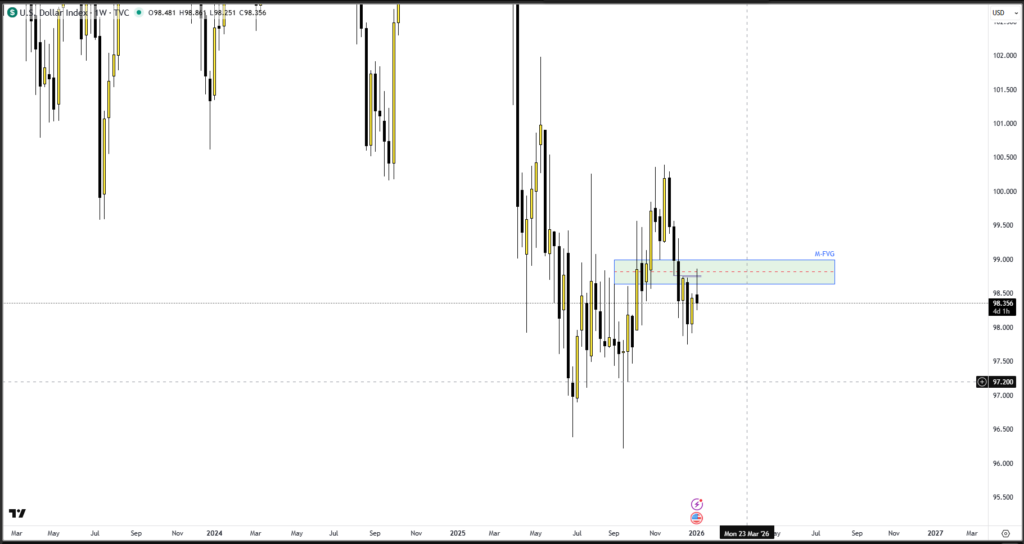
Take a look below at how that translates to the weekly chart. Where we see the weeks of December 15th and December 22nd both had their BSL targeted today Monday, January 5, 2026. If you look closely you will also see a very thin FVG that price wicks into on this weekly chart.
US Dollar Weekly Chart
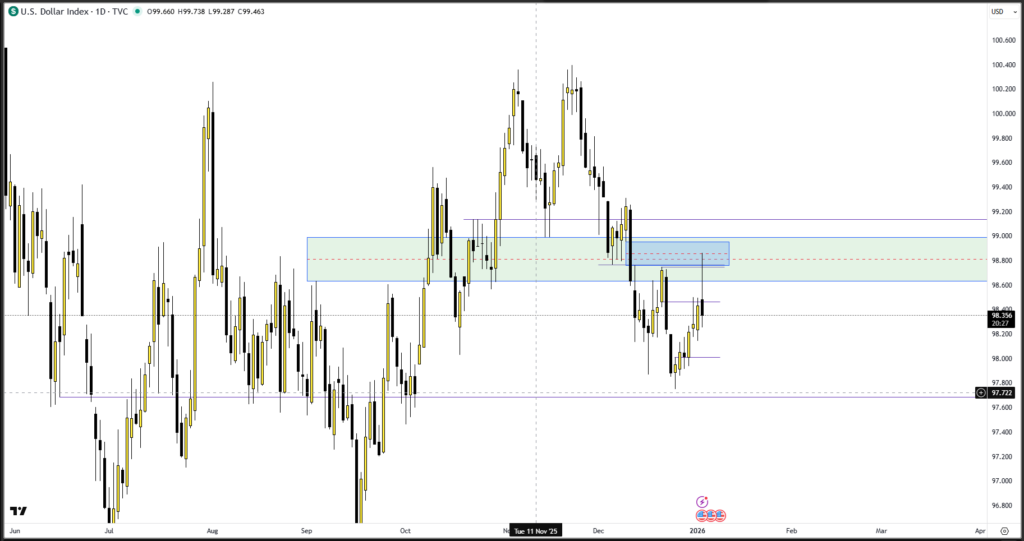
We now have the Daily chart below. I am monitoring how the bodies stayed below the swing high and only the wick swipes above. If price was to fall from here I would be eyeballing a target of 97.68.
I will monitoring price tomorrow to see if it continues to be bearish or does want to make another attempt to get back into the highlighted daily gap!
US Dollar Daily Chart
Moving on to the ES Chart
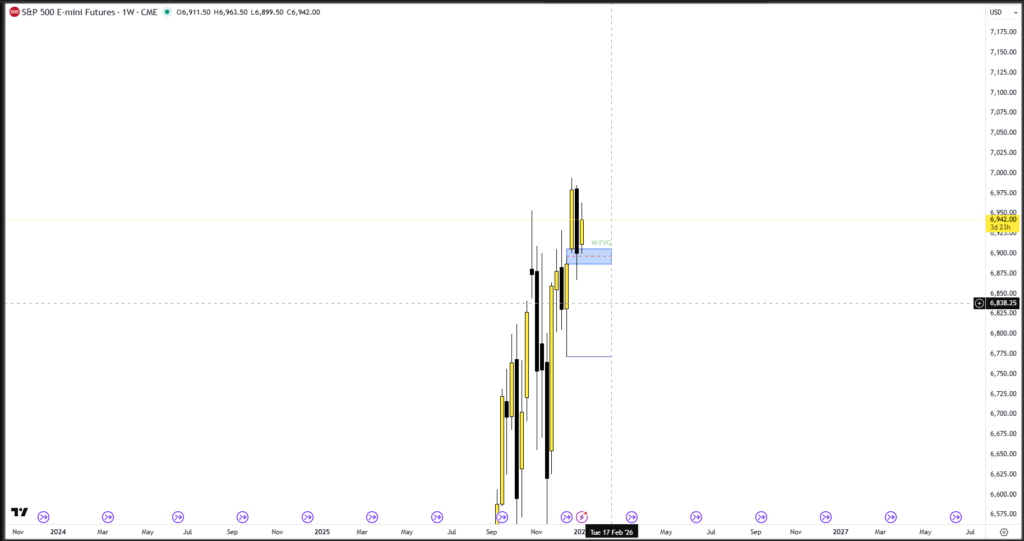
As we spoke about in the video above. SP500 did indeed give us that bullish move out of the Weekly gap it was in during the video!
SP500 Weekly Chart
On the daily we see that price delivered directly to the ” Hot Zone” targets we spoke about in the video above. I want us to note how the body of this daily candle although it wicked up, came right back and respected C.E. of that inverse FVG. I am referring to the lower red box on the chart below.
SP500 Daily Chart
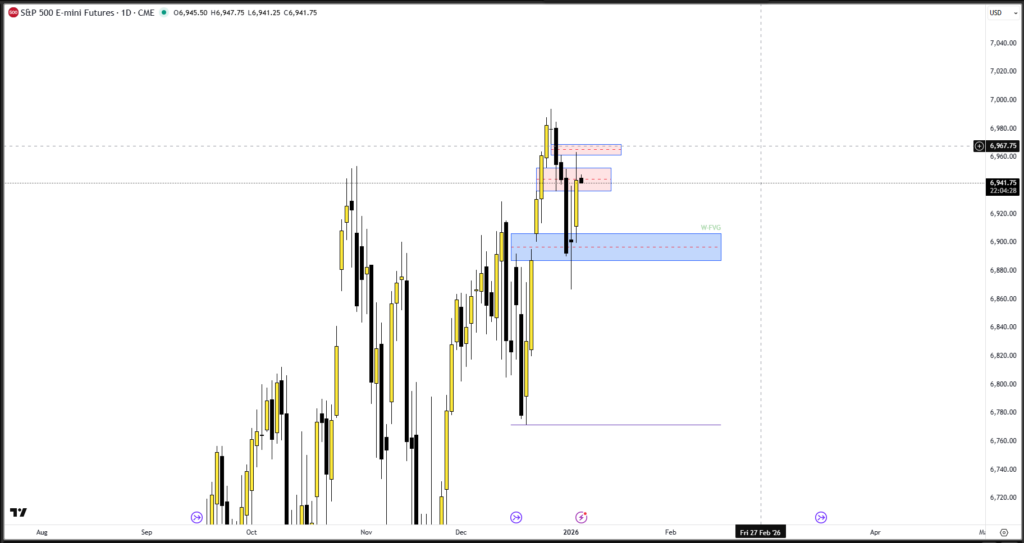
Going into tomorrow there will be a clear SMT among the Indices. I am interested to see if we post a high of the week going into tomorrow or if ES can muscle the strength to push through to ATHs the way Dow Jones was able to do today.